
Government should adopt a different approach to measuring how effectively the Harambee Prosperity Plan is being implemented.
The dangers of linking targets in Harambee to international rankings were highlighted by the release of Transparency International’s latest Corruption Perceptions Index (CPI) recently.
Namibia’s score worsened slightly – by one point – from 53 to 52 (100=no corruption) but the country plummeted eight places down the rankings from 45th to 53rd. This followed a rise of 10 places from 55th to 45th between 2014 and 2015.
The Harambee Plan states confidently, “the 2015 rating improvement of 10 positions was due to a number of measures that the President introduced, such as declaration of assets by the President and First Lady and the release of Ministerial Performance Contracts.”
In fact, this yo-yoing on the CPI rankings has little to do with actual anti-corruption efforts. Due to insufficient data, the 2015 rankings were based on a reduced sample of 168 countries and not the 175 assessed in the previous year. Many of the island nations and small countries that were missed out usually achieve a better score than Namibia. Hence Namibia rose up the rankings. In the latest CPI these smaller nations have been included again – pushing Namibia down the rankings.
It is more important therefore to look at the score of 52 which indicates that Namibia is not making progress in the fight against corruption. If Harambee is to use the TI CPI it would make more sense to say Namibia should achieve a score of 60 by 2020.
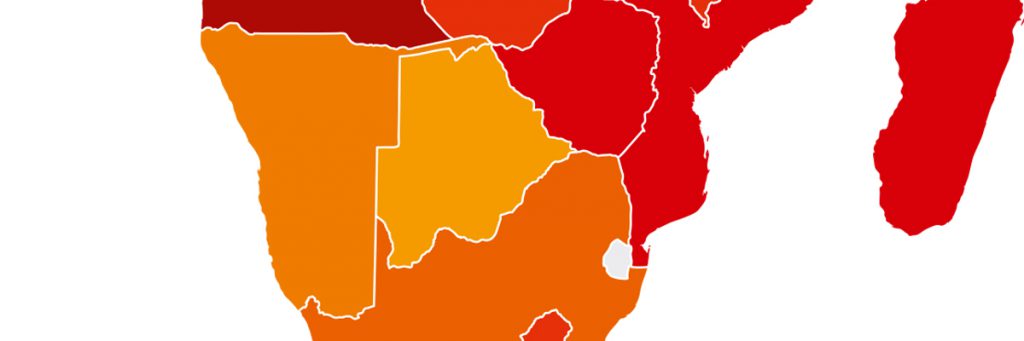
The Harambee Plan says Namibia should be the least corrupt country in Africa by 2020. To achieve this we would have to rise from our current 53rd on the CPI rankings to overtake Botswana at 35th. This would require an improvement of at least eight points on our 2016 score of 52. Beating Botswana is certainly not beyond the bounds of possibility. However, the underlying question remains: are these rankings actually useful benchmarks against which to measure ourselves? And would other locally-derived indicators serve as more accurate and timely signposts as to how we are doing?
It is not too late to adapt the Harambee Prosperity Plan by adding other key performance indicators (KPIs) that are primarily based on Namibian benchmarks.
Often it is presumed that perceptions-based surveys like TI’s Corruption Perceptions Index (CPI) are based on a poll of people’s views in Namibia. In fact a more accurate way of describing the CPI would be a ‘survey of surveys’. For example TI’s 2015 Corruption Perceptions Index (CPI) used five different data sources. Three of the data sources for the CPI are only available to paying clients and therefore cannot be double-checked for accuracy.
But the main problem with the TI CPI, in terms of using it as a key performance indicator for an ongoing development plan, is that the data is often up to one or two years old. TI’s 2015 CPI was published in February 2016. The latest information used comes from August 2015 in the case of two data sources, while others go back as early as the start of 2013. Presumably due to cost and logistical hurdles the TI CPI is not based on timely in-country assessments or surveys.
Such perception-based surveys are useful in that they give an overall sense of progress on governance issues over a period of the previous two years. However, in most cases, they do not include the kind of specific data that would help monitor the progress of a focused and time-limited national development plan, such as Harambee.
An alternative would be to create a matrix of Namibian key performance indicators. This would be relatively simple to fill out but would provide a regular snapshot of progress on key issues. Key performance indicators should be measurable, in most cases quantifiable, and focus on the achievement of outcomes critical to the success of the Harambee Prosperity Plan.
By taking such an approach, government could develop its own scorecard showing real-time or near to real-time progress instead of looking at international assessments that can be based on limited sources and affected by serious time lags. Citizens could also chart progress by monitoring progress through the scorecard. This would provide a form of review by civil society and an added level of accountability.
Possible localised governance indicators for Namibia:
- Fulfilment of ministerial performance agreements
- Asset declarations made by certain deadline
- Percentage of GRN websites updated
- Number of SOE annual reports published
- Number of ministries offering feedback options for citizens via social media
- Percentage of Auditor General reports published in time
- National budget – Availability of documents
image credit: Transparency International
